To successfully manage a patient who is in cardiac arrest, the caregiver must carefully, immediately, and systematically identify the cardiac rhythm and choose the most appropriate treatment algorithm.
In the following lessons, we'll look at different cardiac dysrhythmias that can lead to cardiac arrest, their characteristics, and the appropriate therapies used to treat and correct the particular dysrhythmia whenever possible. However, in this lesson, we'll first look at interpreting the information on ECGs.
Pro Tip #1: It's important to remember that knowing the patient's medical history, including all the events that have led up to the medical emergency, will greatly aid you in determining if there's any chance of reversing underlying causes for the cardiac arrest.
An example of the above would be assessing the patient using the five H's and five T's. (Which will be discussed in detail in the secondary survey section of this program.)
The Five Hs
- Hypovolemia
- Hypoxia
- Hydrogen ion (acidosis)
- Hypo or hyperkalemia
- Hypothermia
The Five Ts
- Tension pneumothorax
- Tamponade
- Toxins
- Thrombosis (coronary)
- Thrombosis (pulmonary)
Pro Tip #2: It's also important to remember that until an underlying cause has been identified and corrected, pharmacological and electrical therapies might offer little or no help when trying to resuscitate a cardiac arrest victim.
When assessing the electrical activity of a patient's heart, it's vital to recognize the underlying dysrhythmia and know how to treat it appropriately to restore a perfusing cardiac rhythm.
A sinus rhythm is defined as any cardiac rhythm where depolarization of the cardiac muscle begins at the sinus node, which is characterized by the presence of correctly oriented P-waves on the electrocardiogram.
 An ECG waveform represents each electrical event in the cardiac conduction system during a cardiac cycle.
However, this doesn't mean that the heart muscle is reacting properly or in correlation with the electrical patterns. It simply shows that the electrical events that may stimulate myocardial function are happening. (This will be discussed in more detail when we look at each individual rhythm.)
Waveforms Explained
For the following explanations, we'll be assuming that the waveform is normal, and that normal mechanical function is occurring.
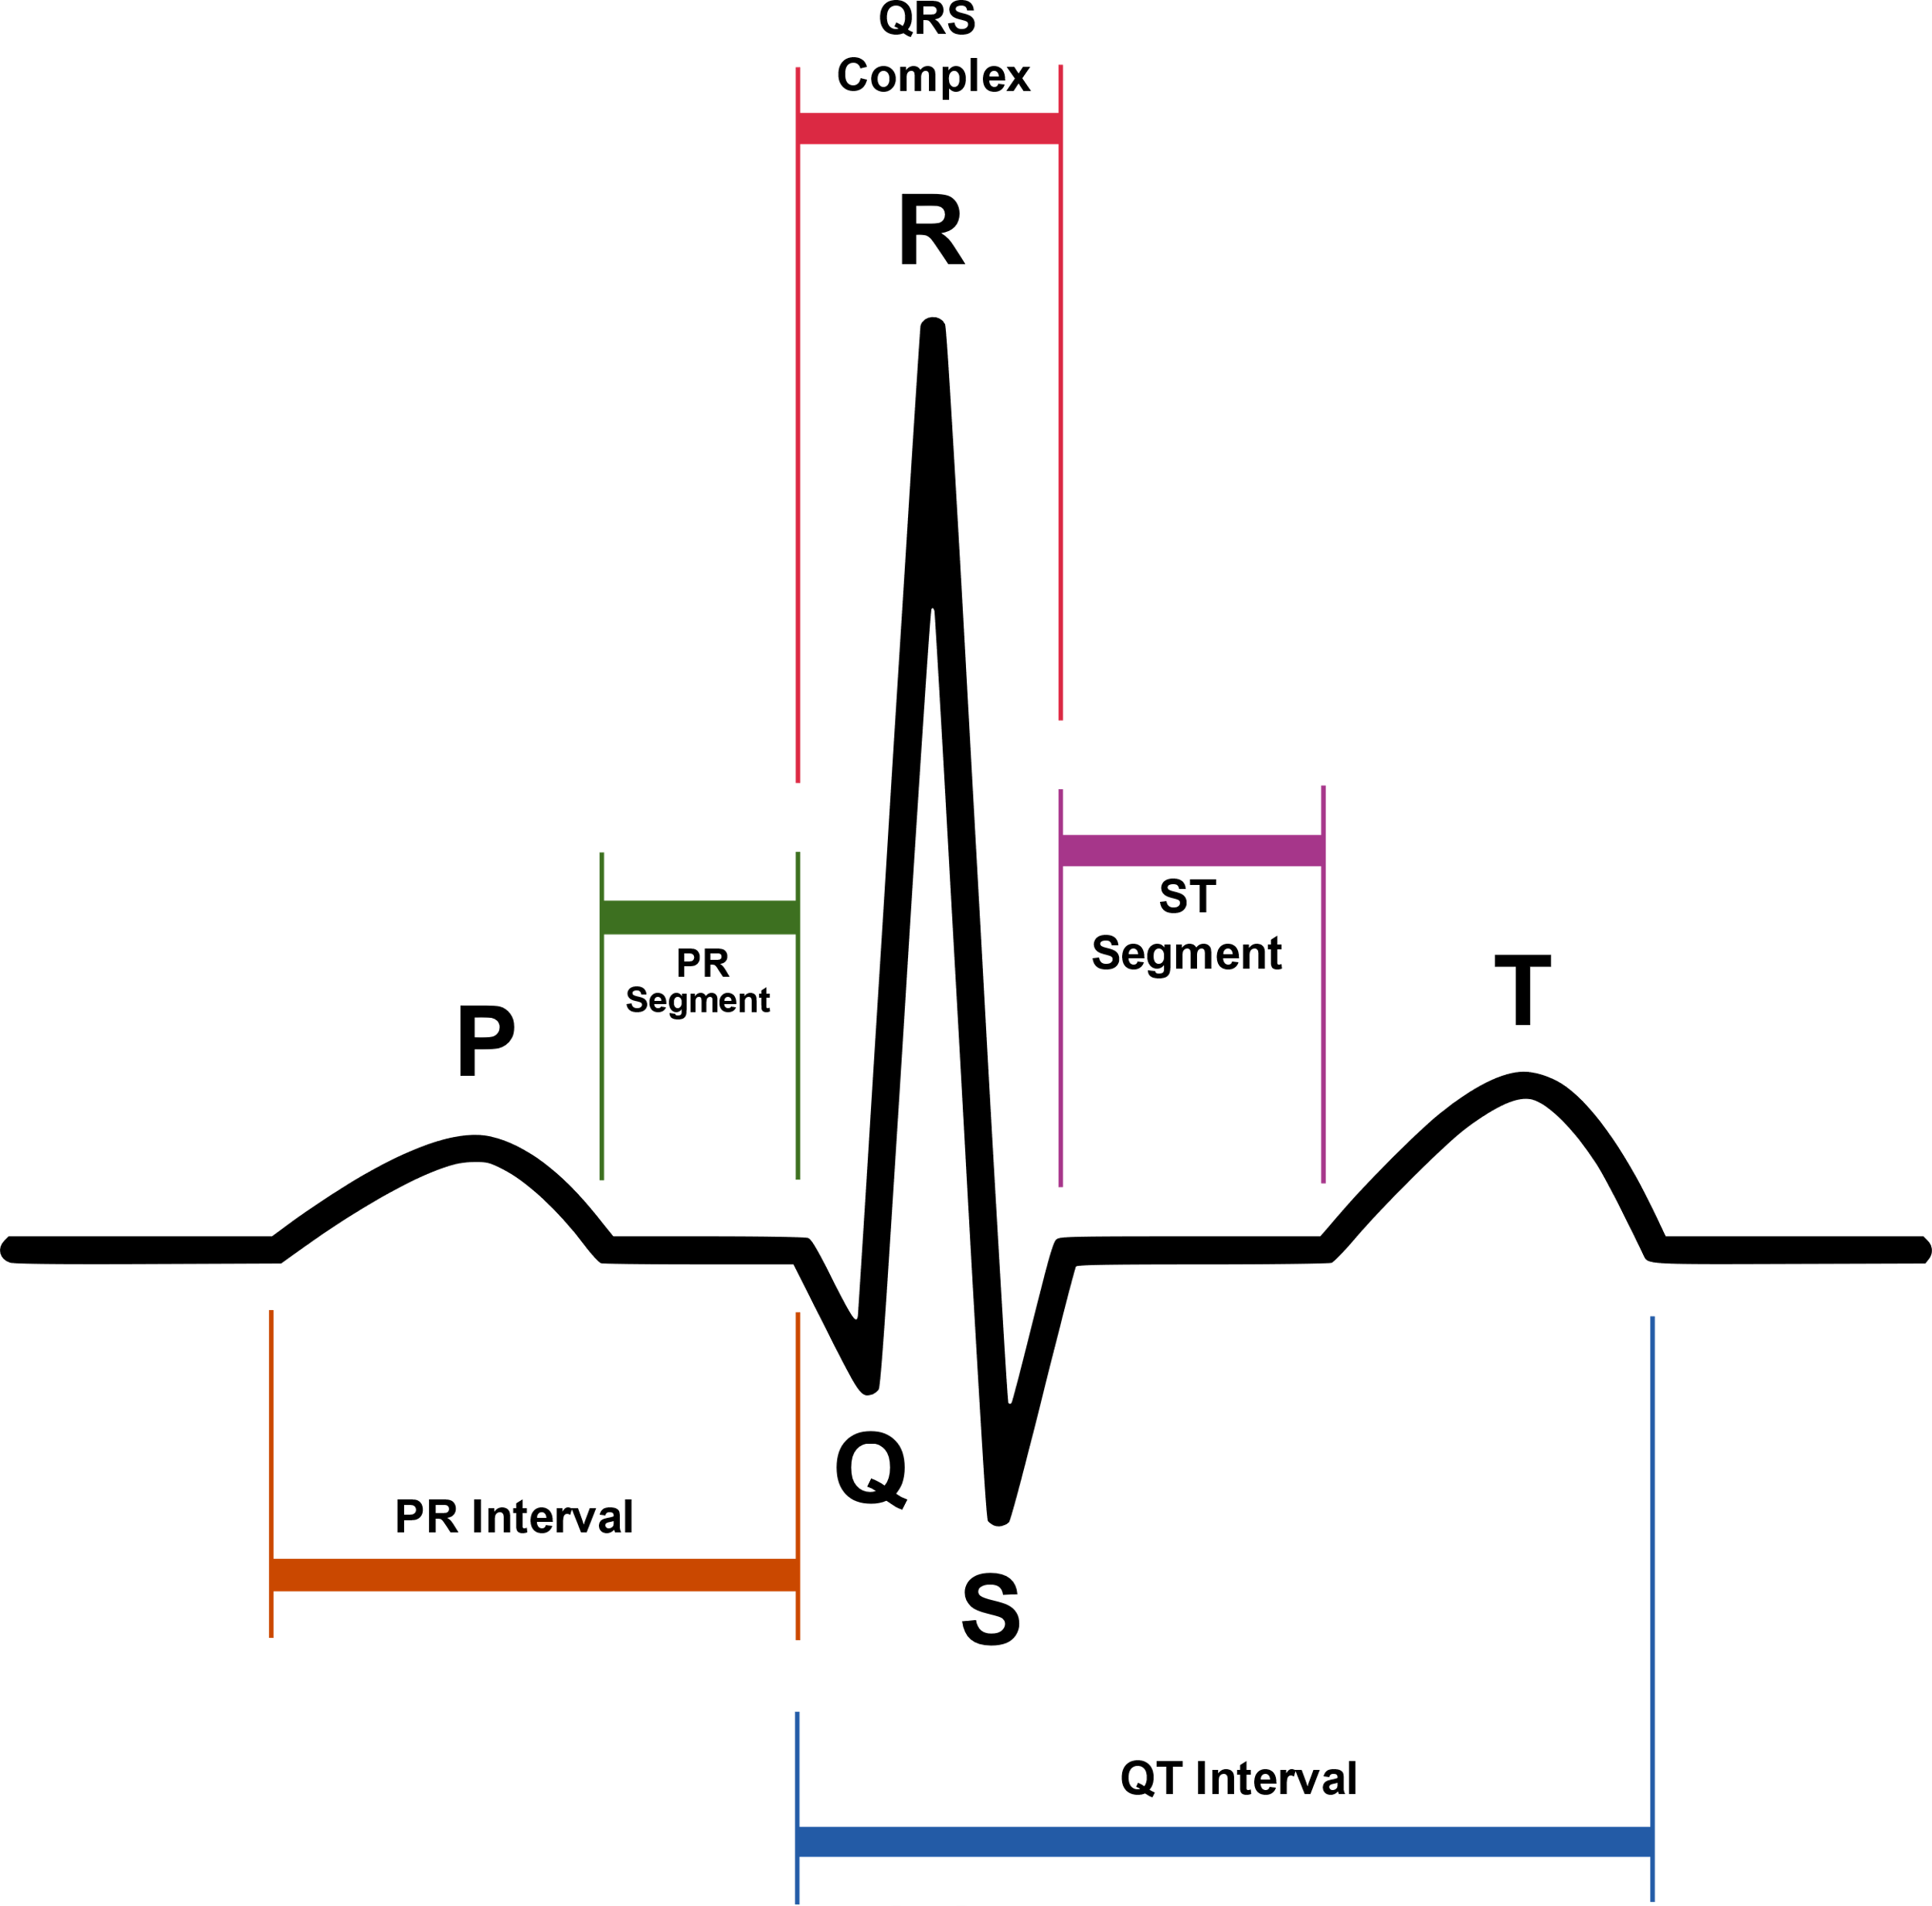
The P-Wave
The P-wave is the first waveform in the complete waveform complex, and it's normally found upright in healthy patients. It represents the depolarization of both the right and left atria, which occurs at the same time.
The PR Segment
The segment between the P-wave and the R-wave represents the delay of the electrical circuit in the AV node. This segment shows the time it takes from the end of the P-wave to the beginning of the ventricular response, represented by the QRS complex.
The QRS Complex
The QRS complex is the combination of three of the graphical deflections seen on a typical electrocardiogram (EKG or ECG). It is usually the central and most visually obvious part of the tracing; in other words, it's the main spike seen on an ECG line.
The Q-Wave
The Q-wave represents the first activity of the ventricular depolarization and is usually the first negative deflection after the P-wave in the complete complex. (We'll discuss the significance of Q-wave formations specifically as it relates to certain dysrhythmias in each of the rhythm evaluations.)
The R-Wave
The R-wave is the first positive deflection after the P-wave.
The S-Wave
The S-wave is the first negative deflection after the R-wave.
The ST Segment
The ST segment represents the timeframe between ventricular polarization and repolarization. It's the baseline of the cardiac cycle and, therefore, electrically neutral; there should be no inflection or deflection as it's isoelectric.
Pro Tip #3: An ST elevation or depression of more than 1mm can be clinically significant and may indicate an underlying cardiac issue, either acutely or chronically.
The T-Wave
The T-wave represents repolarization of the ventricles and should be seen moving in the same general direction as the QRS segment. If the T-wave is inverted, this could also indicate a potential cardiac problem.
It's quite helpful for healthcare providers to have a repeatable and easy method for interpreting ECG rhythms, which is why we'll be following a serial pattern for reading and interpreting all ECGs.
Interpreting ECG Rhythms
The pattern of interpretation most commonly used is to look at the following:
- Is the rhythm regular or irregular?
- Is the heart rate normal, fast, or slow?
To determine the patient's heart rate
The horizontal axis of ECG paper grids is where time is measured. Each small square is 1mm in length and represents .04 seconds. Each larger square is 5mm in length and represents .20 seconds. Therefore a 6 second interval would be 30 large squares.
To determine the heart rate, count the number of QRS complexes over this 6 second interval and multiply by 10.
- Are the P-waves present? Do they occur regularly? Is there one P-wave for each QRS complex? Are they smooth, rounded, and upright? Do they all have a similar shape?
- Does the PR interval fall within the norm of .12 to .20 seconds? Is it constant?
- On the QRS complex, is the QRS interval less than .12 seconds? Is it wide or narrow? Are they similar in appearance?
When using a systematic approach for interpreting ECG rhythms, you'll help yourself and your teammates to efficiently and effectively diagnose underlying cardiac conditions. Which, goes without saying, will also help the cardiac patient.