To successfully manage a patient who is in cardiac arrest, the caregiver must:
- Identify the patient’s cardiac rhythm
- Choose the appropriate algorithm for treatment
The patient’s past medical history and any or all events leading up to the medical emergency will help the health care professional determine if there is any chance of reversing any underlying cause for the cardiac arrest. Until the underlying cause of the patient’s current condition has been identified and corrected, pharmacological and electrical therapies may not help in resuscitating the cardiac arrest victim.
Healthcare professionals need to be able to recognize the underlying dysrhythmia of the victim’s heart and know how to treat it to restore a perfusing cardiac rhythm. To understand what a dysrhythmia looks like, we must first understand each event of a normal ECG. An ECG waveform represents each electrical event in the cardiac conduction system during a cardiac cycle:
P Wave
P waves are the first waveform in the complete complex, normally found upright in most leads. They represent the depolarization of both the right and left atria, which occur at the same time.
The segment between the P wave and the R wave represents the delay of the electrical circuit in the AV node. This is the time it takes from the end of the P wave to the beginning of the ventricular response represented by the QRS complex.
Q Wave
Q Waves represent the first activity of the ventricular depolarization, usually the first negative deflection after the P wave in the complete complex.
R Wave
R Waves follow the Q waves. They are the first positive deflection after the P wave.
S Wave
S Waves follow R waves. They are the first negative deflection after the R wave.
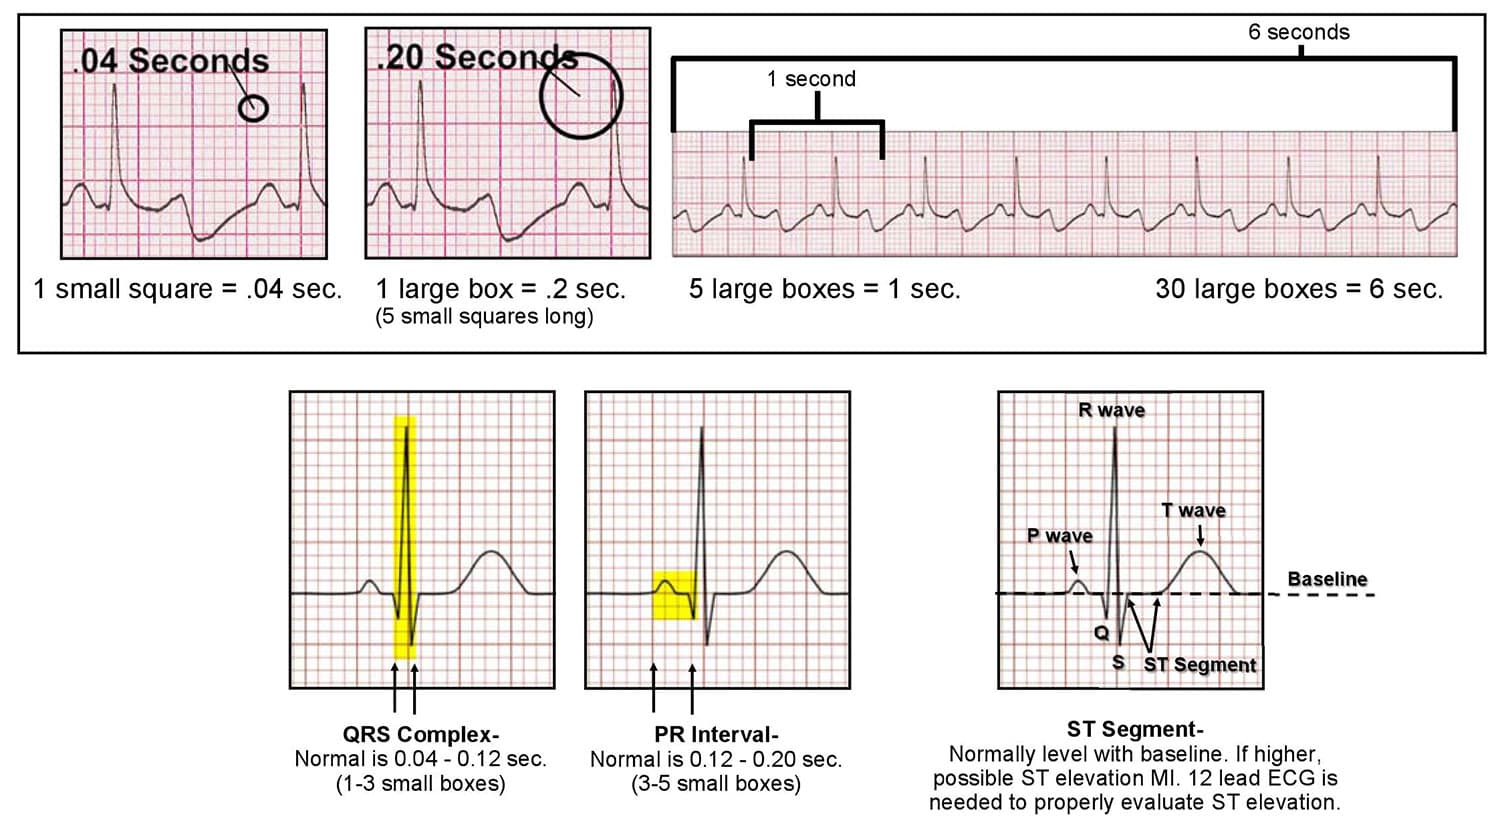
The length from the end of the S wave and the beginning of the T wave is the ST segment. This segment indicates the timeframe between ventricular depolarization and repolarization. It is the baseline of the cardiac cycle and is electrically neutral.
There should be no inflection or deflection, since the ST segment is isoelectric. ST elevation or depression of more than 1mm may indicate underlying cardiac issues, both acutely and chronically.
T Wave
T Waves follow S waves. They represent the repolarization of the ventricles. The T waves should be seen in the same general direction as the QRS segment. An inversion of the T wave can indicate a cardiac problem.
The following questions should be asked to read and interpret ECG’s:
Rhythm
- Is the rhythm regular or irregular?
Rate
- What is the rate?
- Is the rate normal, fast, or slow?
- ECG Paper Grids
- Each small square is 1 mm in length and represents 0.04 seconds
- Each larger square is 5 mm in length and represents 0.2 seconds
- A six second interval would be 30 large squares
- To determine heart rate, count the number of QRS complexes over a 6 second interval, then multiply by 10 (Note: this method works well for both regular and irregular rhythms)
P Waves
- Are they present?
- Do they occur regularly?
- Is there one P wave for each QRS complex?
- Are the P waves smooth, rounded, and upright?
- Do all P waves have similar shapes?
PR Interval
- Does the PR interval fall within the norm of 0.12-0.20 seconds?
- Is the PR interval constant?
QRS
- Does the QRS interval fall within the range of 0.08-0.10 seconds?
- Is the QRS wide or narrow?
- Are the QRS complexes similar in appearance?